Product companies have moving parts and challenges that other industries do not face. Some managers track dozens of key performance indicators (KPIs) in order to overcome these challenges, but this creates a maze of confusing data and no map to make intelligent decisions. This problem is common. In fact, the #1 result when searching “product company KPIs” is an article called “15 Key Production Management Metrics.” Fifteen?! Another article cites no less than 42 essential KPIs. It is neurologically impossible to digest this many numbers.
What business owners need are simple KPIs to inform their decisions:
- What is the business profitability?
- Should we invest more in growth, or first improve our efficiency?
- Can we afford to bring on a new employee?
If your KPIs are not clearly addressing these issues, they are failing. At CFOshare, we frequently see founders losing sight of strategy while buried in KPIs. When we work with a growing product company, we focus on two critical questions:
-
-
- Is our growth sustainable?
- What will it take to be profitable?
-
A KPI for Growth Sustainability: Acquisition Profit per Order (APPO)
Is growth killing your profitability? Or is growth boosting your profitability? APPO answers this question. Acquisition Profit per Order (APPO) is how much money is made per order after all cost of goods sold and acquisition costs. It is the adjusted gross profit per sale.

APPO adjusts Gross Profit by adding variable selling costs and then dividing by orders.

Variable selling costs can include advertising, variable contractor fees, commissions, PR campaigns, and other variable sales and marketing spend. It should NOT include salaries, fixed marketing contractor fees, S&M software, other fixed S&M expenses.
APPO Example
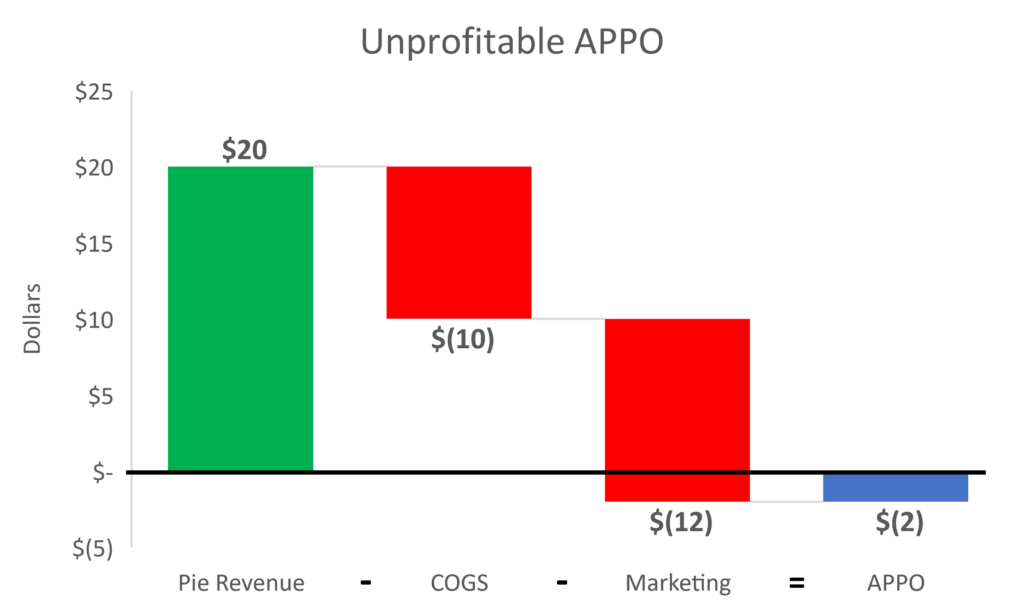
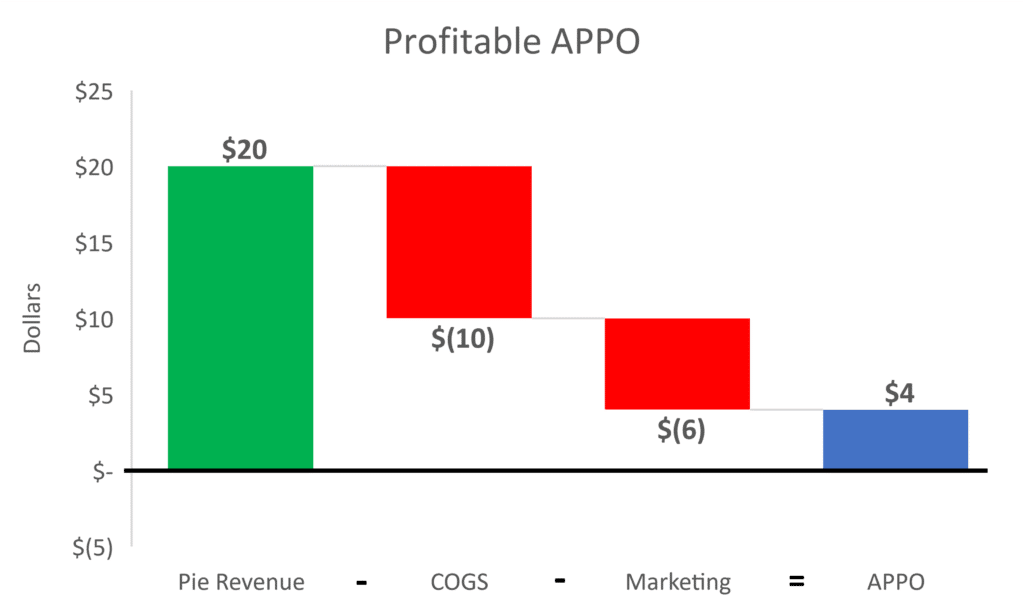
A pizza place sells one pie for $20, it took $10 to make the product, and $6 for the marketing ads. In this case the APPO is $20-$10-$6=$4. Therefore, we know the pizza place makes money on every unit they sell. However, if the marketing cost were $12 per unit, the APPO would be $20 price – $10 cogs – $12 marketing = -$2, and they would be losing money on each order.


Why APPO works
At a high level, APPO will help you better understand how much money you make (or lose) per order. Gross profit alone does not provide a complete picture – by adding selling cost, the largest and most critical variable cost to growth, you can better understand your unit profitability.
When interpreting APPO, it is crucial to see if it positive or negative and how it changes overtime.
- Negative APPO: the focus should be on improving metrics; otherwise there is a tradeoff between profitability and growth.
- Positive APPO: invest in growth, continue to improve metrics, or both. The appropriate strategy depends on the unique factors in every business.
- APPO over time: track to understand business progress and volatility.
For advanced analysts, APPO can also be turned into a ratio. APPO ratio will allow you to better compare different products or different companies. APPO also allows you to easily calculate your break-even…
A KPI for Break-Even: APPO Coverage
Where should you set sales targets? Are you going to make money this month? APPO Coverage gives you the quick answer: how many orders you need to sell to break even.

Make sure overhead expenses exclude the variable selling costs already included in APPO.
APPO Coverage Example
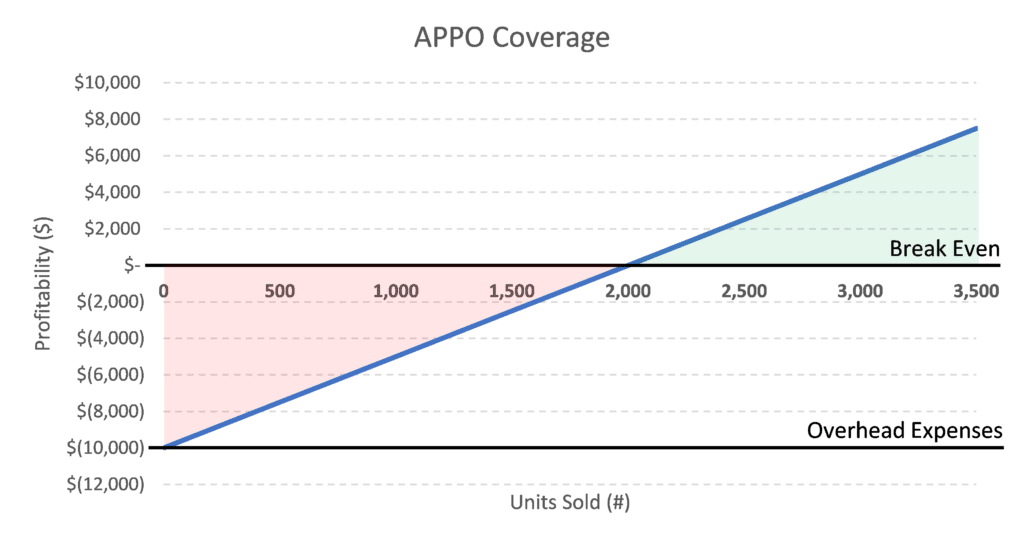
An ecommerce T-shirt company has an APPO of $5, and they have monthly overhead expenses of $10,000 per month. The companies APPO Coverage is $10,000/$5=2,000 units. This means the company needs to sell 2,000 units per month to break even. If they sold 1,800 units last month than they have a 200-order deficit [2,000-1,800] to hit the APPO Coverage. This provides a good barometer of where the company sits in terms of overall profitability.

Why APPO coverage works
At a high level, APPO coverage provides an amount of orders needed to be sold to break even. It creates one simple metric to understand the state of the business by applying volume of orders to profitability.
When interpreting APPO Coverage, it is important to compare to historic sales volumes and to understand the impact of changing the expense structure.
- Comparing APPO Coverage to historic sales volume will give you a benchmark of how close the company is to profitability. Is the coverage volume attainable in the short term? Do you have capital to cover the order deficit while growing your business?
- Understand the impact of changing the expense structure. What are the largest expenses contributing to the coverage volume? How will adding an employee impact the APPO Coverage?
Using Two KPIs to Manage a Product Company
Imagine all your monthly management meeting begin with reviewing 5 simple KPIs: revenue, EBITDA, cashflow, APPO, and APPO coverage. How much more time would you have for discussion and collaboration on growth tactics? How much more engaged would your staff be? APPO and APPO coverage cut through the noise of the P&L and the subjectivity of marketing metrics like ROAS. They allow you to quickly answer critical questions by clearly tracking unit and company profitability.
These metrics are robust because they contain all the key components from the Profit and Loss Statement (P&L) but in an easy to read format.
Are the other KPIs useless? Hardly. But they are all details captured by APPO. For Example, Average Order Value (AOV) drives sales which impacts APPO; and Payroll drives operating expenses which impacts APPO Coverage. Therefore, once you understand APPO metrics, you can efficiently analyze the underlying KPIs to enact change. This includes average order value (AOV), gross margins, return rates, cost per order (CPO), returning & organic customer rates, customer acquisition cost (CAC), and more.
In other words, the individual KPIs are the details that drive your business, while APPO metrics interpret what the KPIs mean in relation to your business.
The Danger of Relying on KPIs
Have you heard the horror stories of a manager obsessed with a single metric? That’s because KPIs are a simplification of the business and, as with any KPI, APPO and APPO Coverage are single tools in the toolbox. Therefore, they have limitations and shortcomings, and should always be complimented with other tools. The major shortcomings to be aware of are:
- They are not a cash flow metric. Therefore, it does not account for working capital, namely inventory which can have a large strain on a business’s cash flow.
- They are a simplification of many KPIs. It is a strength because is adds simplicity to a maze of metrics; however, to make change in the business you will want to drill into individual KPIs (e.g. return rate, AOV, CPO, etc.)
If you are aware of its shortcomings and compliment them with other resources, APPO and APPO Coverage can be powerful tools to make intelligent business decision!
How would powerful data improve your business? At CFOshare, our team of financial experts helps small business owners integrate APPO and other underlying KPIs with business strategy. Contact us today to learn more.


