Bookkeeping | Small Business | Strategy
How to Compare Budget vs Actual Report
August 14, 2024
A small business budget is not much use if you only look at it once per year. The best businesses review a budget vs. actual report monthly with their CFO. This classic method of evaluating performance stands as one of the most important monthly financial reports for any company.
Whether you budget yourself or with the help of a fractional CFO, using budget v actual report will level up your business performance.
What is Budget vs Actual Variance Analysis?
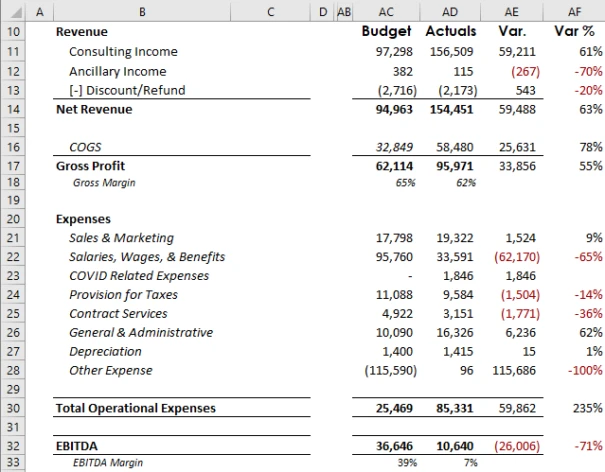
Also known as a budget variance analysis, a budget vs actual report compares budget or forecast goals against actual performance for the profit and loss statement, balance sheet, and KPIs. The budget vs actual report is designed to:
evaluate business performance against the plan,
analyze the cause of financial deviations, and
inform better management decisions.
By reviewing a variance analysis with managers, you force them to reflect on past performance, confront the financial consequences, and discuss remedies. This proves crucial for alignment to your financial goals.
Why is it a good idea to compare budget against actual figures?
Although budgeting is a critical planning process, your business will never hit all your budget goals. That’s ok – missing your goals is an opportunity to learn about your evolving business and improve predictions.
Comparing actual results against budget allows you judge the effectiveness of your tactics and optimize performance. Without actual vs budget reports to measure your performance, you are flying blind.
How do you analyze budget vs actual?
Follow these 6 steps to build a simple variance report:

Create a new spreadsheet separate from your financial forecasts.
Enter your summarized or detailed income and expense accounts in the first column.
Enter your budgeted amount for each profit and loss account for January in the second column.
Enter the actual values for each P&L account for January in the third column.
Create a “variance” formula in the fourth column (actual minus budget.)
Create a “variance %” formula in the fifth column (variance / budget)
Repeat this process every month for your key financial statements:
the profit and loss statement
the balance sheet
the statement of cash flows, and
the business KPIs.
Some software tools use integrations, ETL, or other advanced techniques to automate this process; but data connections are complex, so we recommend a simple manual entry process unless you are experienced at data automation.
What is a budget variance?
Variances are deviations from the company plan, good or bad. For example, a revenue miss of $100k is an unfavorable variance. A $30k reduction in software expense is a favorable variance.
When reviewing a variance analysis with your managers, take time to identify and discuss:
Large variances. These are key drivers of your company’s performance.
Consistent, reoccurring variances. This indicates budgeting or forecasting error; or lack of discipline in business management (especially for unfavorable expenses.)
Variances growing each month. This is an early warning of a growing trend management should be aware of.
Remember, variances often interact with each other. For example, an unfavorable revenue variance is often partially offset by a favorable COGS variance.
How do you decrease bad variances in the budget?
Changing the financial course of your business usually requires collaboration with your team. To facilitate a healthy discussion about budget variances with your managers, hold a meeting to review the budget vs actual report and ask them:
What actions or lack of actions drove these results?
If we could re-do last month, what would you have done differently?
What learnings can we carry forward into next month?
Should management stick with this strategy, invest more in this strategy, or pivot to change strategies?
Remember, discussing favorable variances is just as important so your team knows how to lean-into winning strategies.
Help performing variance analysis
If you find yourself spending lots of time updating your monthly variance analysis, not understanding the results, or simply not performing the analysis, you should get help. Consider fractional CFO services to quickly and reliably implement a budget to actual variance analysis tool.
Related Articles
Ready to Elevate Your Finances?
Need more specific advice? Schedule a consultation


